
Testing Central Limit Theorem with R


In this article, we will verify the Central Limit Theorem which says that a distribution of sample means of samples from a distribution of a random variable approaches that of a normal distribution with increasing sample size. Put simply, if multiple samples are taken from a distribution (normal or otherwise) and the mean of the samples are computed then the collection of sample means hence generated will itself form a distribution and that distribution will be the Normal Distribution (provided the sample size is large). One corollary of the Central Limit Theorem is that the sample mean will approach the population mean as the sample size goes to infinity (or the population limit). One way to verify this statement is to do the sampling using random variables generated by R and then calculate the sample means for each set of random numbers.

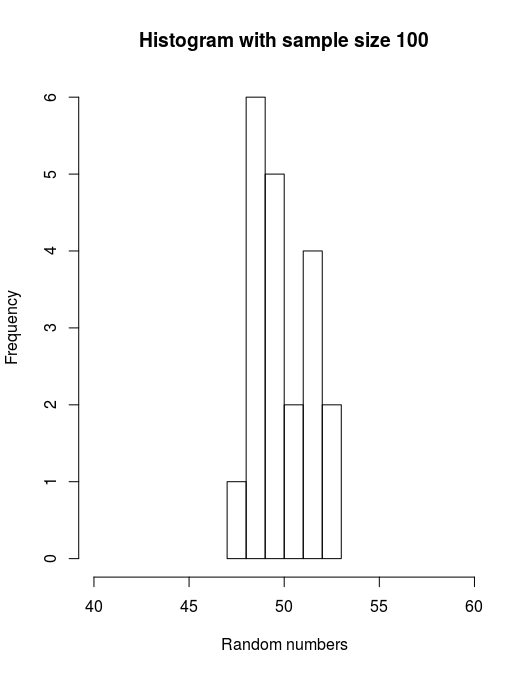
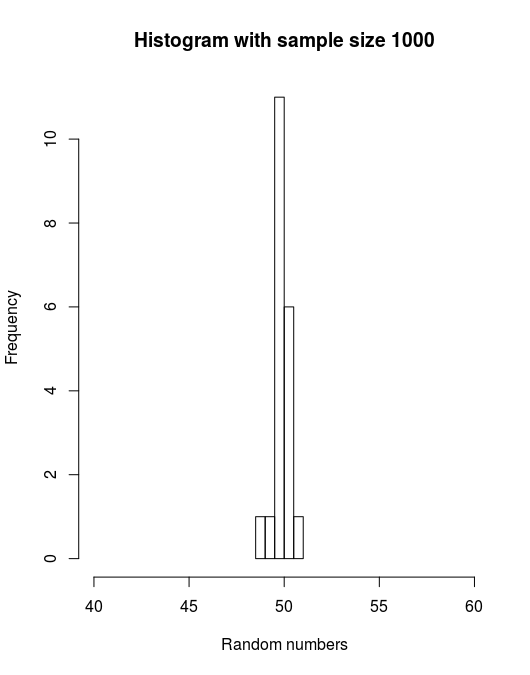
Using R we will generate a sample of N normal random numbers and repeat that sampling 20 times each time finding the mean of the sample of the 20 random numbers. Then plot the means. If the random numbers are normally distributed then with increasing sample size N, the standard deviation i.e. the width of the histogram will become narrower and narrower due to the Central limit theorem. If the histograms keep getting narrower and narrower with increasing sample size then we have verified the Central Limit Theorem.

Set the sample size
> N = 10
Initialise array of size 20 and fill it with 0
> mn = array(rep(0,20), dim=c(20,1))

Initialize an array of size (20,N) and fill it with 0
> nr = array(rep(0,20*N), dim=c(20,N))

Create a loop which will generate N random numbers and calculate their mean and store it in the array mn[]. The function rnorm(100, 50, 15) generates 100 random numbers which are normally distributed with a mean of 50 and a standard deviation of 15.

> for(i in seq(1,20)){
+    nr[i,] = rnorm(N,50,15)
+    mn[i] = mean(nr[i,])
+ }

Plot the histogram of the collection of sample means. xlab sets the xlabel or the label for the x-axis. ylab does the same for y-axis but R automatically chooses the right label "Frequency" for the y-axis. main sets the title of the plot while paste() concatenates the value of the dynamic variable N, the sample size, to the text.
> hist(mn, xlim=c(40,60), xlab = "Random numbers", 
+      main = paste("Histogram with sample size",N))
Repeat this by increasing the sample size N to 100, 500, 1000.


Comments

Popular posts from this blog

Fastest way to send multiple drafts from gmail

People claim that the fastest way to send multiple email drafts is to use Gmail IMAP with email client like Outlook or Evolution or Thunderbird. But I have found this is not true. Because Thunderbird and Evolution etc. email clients treats the drafts as emails still to be edited. So it is not just simple select all and hit send. Each email draft has to be opened and sent separately. That is a lot of clicks and mouse movements, wasting precious time and energy. I have a better solution which involves minimum keystrokes and mouse usage. Efficiency booster technique for sending emails. If someone is feeling adventurous and want to try it from the Gmail interface itself, here's how to do it in the fastest possible manner. It involves using the mouse once. Select the first draft. Gmail would open a new email box and put the cursor inside the box to write. Press TAB once to go the Send button. Press ENTER to send. Now Gmail sends it and the box is gone but the highlight goes to the last

LYRICS OF CHANDRABINDOO

___________________________________________________________________ SWEET HEART FROM AAR JAANI NAA(T-SERIES) -- SWEETHEART -- Pratham college-er din ta Aajo thik e mone poRey scene ta Dada didi haath dhorey siNRi tei bose poRey Aamar chokh ta ghorey bon bon bon bon Sweetheart, I am seating alone Sweetheart, for me there is none DhoNk gile chole gelo pratham maas Meye dekhlei feli deergho-shwash DhoNk gile chole gelo pratham maas Meye dekhlei othe nabhishwash Meyera bheeshan smart poRey chhoto mini-skirt Aamar e je sheet korey kon kon kon kon Sweetheart, I am seating alone Sweetheart, for me there is none Taarporey kete gelo maas chaar Fuse holo je kato future Bandhura purse khule eke oke taake tole Aamar pran ta korey chon mon chon mon Sweetheart, I am seating alone Sweetheart, for me there is none Ekdin lawn theke beriye Ek tanayaar dike taakiye Hawt korey ki je holo magaj ta ghurey gelo Taar kaaner saamne kori ghyan ghyan ghyan ghyan Sweetheart, I am seating alone Sweethea

Changing the font size of section headings in LaTex

You have several ways to do so: 1.- A direct redefinition of \section: \makeatletter \renewcommand\section{\@startsection{section}{1}{\z@}%                                   {-3.5ex \@plus -1ex \@minus -.2ex}%                                   {2.3ex \@plus.2ex}%                                   {\normalfont\large\bfseries}} \makeatother 2.- By means of the titlesec package: \usepackage{titlesec} \titleformat{\section}{\large\bfseries}{\thesection}{1em}{} 3.- By means of the sectsty package: \usepackage{sectsty} \sectionfont{\large} source : http://www.latex-community.org/forum/viewtopic.php?f=4&t=3245   Now, I would explain the titlesec package a bit more (because it seems easier to me and with more options) : To change the section fonts with this package put the following lines in the preamble - \usepackage{titlesec} \titleformat{\ section }{\ large \ bfseries }{\thesection}{1em}{} Options available are- a> Font size - \normals